Welcome to Data Science Exploration!
A Second-Semester Exploration into the World of Data Science
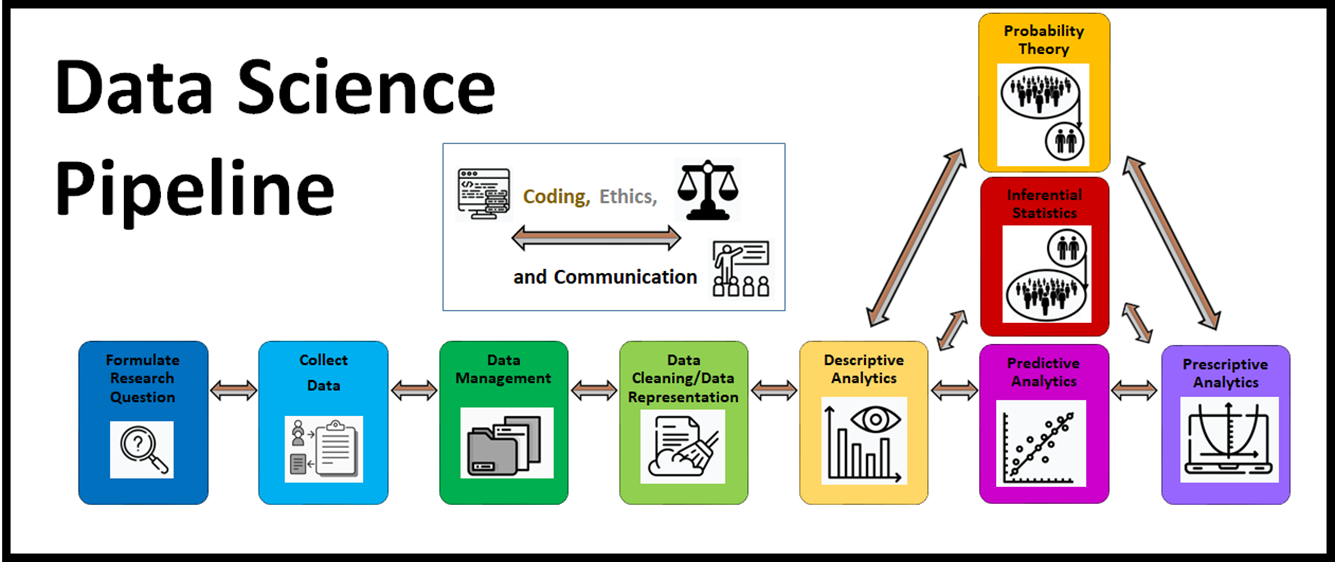
In this second-semester exploration into the world of data science, we bring together the tools learned in Data Science Discovery and introduce students to the interconnected nature of the data science pipeline with real-world datasets in Python. We explore how different decisions can be made along the steps of the data science pipeline in pursuit of a research goal or question. We explore how this may lead to different outcomes or answers. With this in mind, we use well-motivated research goals and questions to explore best research practices when it comes to conducting and communicating a beginning-to-end data science analysis.
With real-world datasets we explore and delve deeper into machine learning and inference techniques. We explore how to build and evaluate linear regression and logistic regression models for machine learning purposes. We introduce feature selection techniques, including regularization and principal component analysis. We introduce cross-validation techniques. We discuss how to build and evaluate classifier models. We also discuss how to build more interpretable models.
We further hone the concepts of statistical inference by simulating sampling distributions and introducing simulation-based inference. Students should learn how to use linear and logistic regression models to evaluate evidence in favor of associations existing in larger populations of data.
Enhanced data wrangling and data visualization techniques are introduced as well.


Module 7: Understanding and Wrangling Data
This module provides an introduction to the interconnected nature of the data science pipeline. We consider what it means to pursue research goals and ask research questions effectively with data. Given that there are often many decisions involved in pursuing a beginning-to-end data science analysis, what are some best practices when it comes to communicating our research findings? Finally, what are some ways in which we might clean and manipulate a dataframe for further analysis?
-
7-00» Your Data Science Journey - From Beginning to End -
7-01» Review of Data Basics -
7-02» Answering Questions Using Data -
7-03» Cleaning and Preparing Data -
7-04» Missing Data -
7-05» Reshaping and Merging Data -
7-06» Summarizing Variables with Statistics, Tables, & Plots -
7-07» Measurement Errors -
7-08» Deeper Dive in Data Cleaning
Module 8: Linear Regression
This module introduces how a linear regression model can be used and evaluated for machine learning purposes. We discuss how to predict a numerical response variable given a set of numerical and/or categorical explanatory variables. Interaction terms and variable transformations are incorporated for enhanced model fit. Finally, we discuss how to make our machine learning regression models more interpretable.
-
8-00» Predicting Airbnb Prices for New Datasets -
8-01» Single Variable Descriptive Analytics and Data Manipulation -
8-02» Describing Associations between Two Variables -
8-03» Describing Associations between Three Variables -
8-04» A Machine Learning Technique for Finding Good Predictions for New Datasets -
8-05» Fitting a Multiple Linear Regression Curve -
8-06» How to Incorporate Categorical Explanatory Variables -
8-07» Interpreting your Model's Slopes -
8-08» Evaluating your Linear Regression Model for Machine Learning and Interpretation Purposes -
8-09» Interaction Terms -
8-010» Airbnb Research Goal Conclusion -
8-011» Variable Transformations
Module 9: Feature Selection and Cross-Validation Techniques
What does it mean to overfit a predictive model? How does an overfit model impact our our ability to pursue machine learning goals? One way to overfit a predictive model is by including too many explanatory varaibles that don't bring 'enough' predictive power to the model? In this section we explore ways of measuring whether or not an explanatory variable brings 'enough' predictive power to a predictive model. We also explore ways of attempting to find the optimal combination of explanatory variables that best meet our machine learning goals for a predictive model.
-
9-00» Introduction -
9-01» Overfitting vs. Underfitting to a Dataset -
9-02» Finding a Parsimonious Model -
9-03» Overview of Feature Selection Techniques -
9-04» Backwards Elimination Algorithm -
9-05» Forward Selection Algorithm -
9-06» Breast Cancer Research Introduction -
9-07» Regularization Techniques -
9-08» Cross-Validation Techniques -
9-09» Principal Component Regression -
9-010» Conclusion
Module 10: Logistic Regression and Classification
In this module we introduce the logistic regression model which is one of the most common models for predicting a categorical response variable with two distinct values. We discuss how to fit and evaluate a logistic regression model for machine learning purposes. Furthermore, we discuss how to use a logistic regression model as a classifier. We discuss how to evaluate the performance of a classifier model. Finally, we implement the features selection techniques that we introduced in module 9 to attempt to find the optimal combination of explanatory variables to use that yields the best classifier performance for machine learning purposes.
-
10-00» Introduction -
10-01» Instagram Classifier Introduction -
10-02» Introducing Logistic Regression -
10-03» Odds and Probability -
10-04» Fitting a Logistic Regression Model -
10-05» Multiple Logistic Regression -
10-06» Making Predictions -
10-07» Slope and Intercept Interpretations -
10-08» Evaluating your Logistic Regression Model -
10-09» Classification with Logistic Regression -
10-010» Feature Selection
Module 11: More Machine Learning Methods
-
11-00» More Machine Learning -
11-01» Decision Trees -
11-02» Random Forests -
11-03» Neural Networks -
11-04» Comparing Machine Learning Models
Module 12: Populations, Samples, and Statistics
-
12-00» Overview of Statistical Inference -
12-01» Populations -
12-02» Samples -
12-03» Describing a Sample with Visualizations and Statistics -
12-04» Sampling Distributions -
12-05» Sampling Distribution Properties -
12-06» Sampling Distribution for Two Populations -
12-07» Sampling Distributions for Regression -
12-08» Simulations for Difference Data -
12-09» Calculating Probability for Statistics -
12-010» Deeper Dive into Underlying Theory -
12-011» Conclusion
Module 13: Statistical Inference for Populations
-
13-00» Overview -
13-01» Population Parameters and Sample Statistics -
13-02» One Hypothesis Testing Example -
13-03» Hypothesis Testing Framework -
13-04» Confidence Intervals -
13-05» Traditional Procedures for Inference -
13-06» Inference for Regression -
13-07» Inference for Logistic Regression -
13-08» Name That Scenario -
13-09» Conclusion