One Hypothesis Testing Example
Starting with this page, we'll begin considering the scenario where we only have sample data; that is, when we refer to df in the following pages, we are using df_sample from the previous page, a random sample of Chicago Airbnb listings from March 2023. Depending on your context, having sample data may be more or less common than obtaining population data. We'll only use our population data to confirm our results and/or demonstrate how inference procedures work.
First, we'll explore how we can test hypotheses. Hypothesis testing allows us to make a decision between two competing theories about our unknown population parameter, allowing us to understand the corresponding population better.
General Motivation and Framework
Hypothesis testing exists to help researchers decide between two competing theories (or statements) about the unknown population parameter. Although we don't know the parameter, we want to use information from our statistic to help guide us to selecting a theory that we have reasonable evidence to support.
For example, suppose that you would like to convince someone that Airbnb hosts have been a host for more than 3 years, on average. We may want to decide between your theory, and another person's theory that this is not true. (We'll work through this example on this page).
What do we do with these theories once we have defined them? One of the theories will serve as a "skeptic's theory". The other theory is one that you hope to persuade the skeptic to believe. How will you successfully persuade the skeptic? The approach used in hypothesis testing is that you will start by assuming the skeptic is actually correct. Then, you'll use your sample to calculate how unlikely (inconsistent) the sample statistic is if the skeptic's theory is correct. If the sample is unlikely enough and meets the skeptic's threshold, then you have successfully persuaded the skeptic to change their mind! If not, the skeptic tells you: "good try, but this isn't convincing enough for me. I'm sticking with my theory."
To help demonstrate the process of hypothesis testing, let's first preview the results of a hypothesis test. Once we've done that, we'll describe the formal steps that we've completed for performing the hypothesis test on the next page. We'll then complete examples and discuss limitations and other implications after this introduction.
Hypothesis Testing Example
How does the process of hypothesis testing actually work?
Suppose that you are trying to convince a skeptic who believes that the population mean time that the host has been on Airbnb for all Chicago Airbnb listings is 4 years (1461 days). You'd like to convince the skeptic that the mean time for hosts on Airbnb is actually longer than 4 years. We can use our sample of Chicago Airbnb listings to calculate the sample mean number of days that a host has been on Airbnb.
df['host_since'].describe()
    count     700.000000
    mean     2188.767143
    std      1095.461269
    min        20.000000
    25%      1480.500000
    50%      2284.000000
    75%      2882.250000
    max      5328.000000
    Name: host_since, dtype: float64
df['host_since'].mean()/3655.996622309197652
We see that for our sample, the average time for hosts to be on Airbnb for the Chicago Airbnb listings was actually much closer to 6 years. Is this different enough from 4 years to convince our skeptic? Our skeptic is quite logical, so we'll need to provide additional evidence to this skeptic to convince them. To do so, we'll adopt the viewpoint that 4 years is in fact the population mean and adjust the data so that this is truly the case (represented in skeptic_data created below).
skeptic_data = df['host_since'] - df['host_since'].mean() + 1461
skeptic_data.mean()
1460.9999999999789
Now, let's use a resampling scheme in order to determine plausible values for sample means if the skeptic were in fact true.
skeptic_sampling_distr = []
for i in range(10000):
    new_data = skeptic_data.sample(700, replace = True)
    skeptic_sampling_distr.append(new_data.mean())
skeptic_sampling_distr = pd.DataFrame({'x': skeptic_sampling_distr})
skeptic_sampling_distr['x'].hist()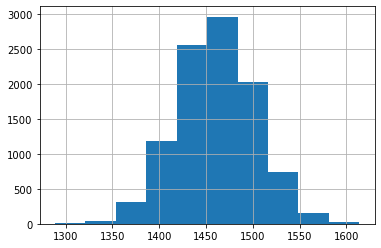
Histogram of a simulated sampling distribution for the median price per night for a Chicago Airbnb.
We see that none of our 10,000 simulated sample means were similar to what we observed from our actual sample (2188 days). That means that if the skeptic were correct, we would not have any samples that had a sample mean close to what we observed in our sample. This would likely convince any skeptic that the population probably doesn't have a mean host time on Airbnb of 4 years.
Testing a Second Skeptic
For illustration purposes, consider that we have a second skeptic who had a different claim about Airbnb owners. Our second skeptic thinks that the population average time on Airbnb was 5 years and 9 months (approximately 2100 days)? We are trying to convince this skeptic that the population mean time is more than 5.75 years.
skeptic_data = df['host_since'] - df['host_since'].mean() + 2100
skeptic_data.mean()
2099.9999999999704
skeptic_sampling_distr = []
for i in range(10000):
    new_data = skeptic_data.sample(700, replace = True)
    skeptic_sampling_distr.append(new_data.mean())
skeptic_sampling_distr = pd.DataFrame({'x': skeptic_sampling_distr})
skeptic_sampling_distr['x'].hist()
plt.xlabel('Simulated Sample Mean Values of Host Since (Days) from Resampling')
plt.ylabel('Frequency')
plt.title('Histogram of Resampled Sample Mean Host Times on Airbnb')
plt.axvline(x = 2188.77, ymin = 0.01, ymax = 0.95, color = 'purple')
plt.show()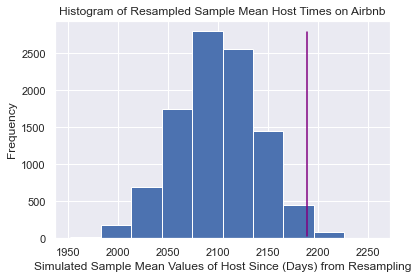
Histogram of the minimum nights required for the population of Chicago Airbnb listings.
Now, in this simulated sampling distribution, there are a few resamples that had similar sample means to our observed sample. What proportion were similar (or larger) than our observed sample mean?
(skeptic_sampling_distr['x'] >= df['host_since'].mean()).mean()0.0146
We see that only 1.46% of our resampled sample means provided evidence similar to our observed sample against the skeptic's claim and in favor of our claim. That means our sample is fairly unlikely if the skeptic is correct - it would only happen about 1.5% of the time (less than 2 samples out of 100, or about 15 samples in 1000). Is this enough to convince the skeptic? It depends on your skeptic.
Personally, I'd say this is fairly strong evidence that my sample isn't consistent with the skeptic's claim. If I were a skeptic, I'd want to reevaluate my claim.