Confidence Intervals
Hypothesis testing is the approach to statistical inference that we use when we have two competing theories that we are trying to choose between. A second approach to statistical inference is confidence intervals, which allow us to present a range of reasonable values for our unknown population parameter. The range of reasonable values allows us to understand the corresponding population better without requiring any ideas to be fully specified.
General Motivation and Framework
We have access to our sample, but we would really like to make a statement about the corresponding population. For example, we can calculate that the median price per night for a Chicago Airbnb was \$126 for a sample. What we really want to know, though, is what the median price per night for a Chicago Airbnb is for the entire population of Airbnbs, so that we can make an appropriate statement for the population.
How can we extend our knowledge from the sample to the population? We can use confidence intervals to help us generate a range of reasonable values for our unknown parameter. This will help us to make reasonable conclusions that should extend to the population appropriately.
To do so, we will combine our knowledge of sampling distributions with our specific sample value. This has many similar flavors to hypothesis testing but is approaching the problem through a different framework. Below, we'll walk through an example followed by the process to generate a confidence interval.
Confidence Interval Example
Like mentioned above, the median price per night for a Chicago Airbnb was $126 in our sample. Can we generate a sampling distribution for the possible values that the median price per night could take from repeated random samples?
We will use the resampling approach to generating a sampling distribution as described previously.
df['price'].median()126.0
sampling_dist_price = []
for i in range(10000):
    sample_df = df.sample(700, replace = True)
    sampling_dist_price.append(sample_df['price'].median())
sampling_dist_price = pd.DataFrame({'x': sampling_dist_price})sampling_dist_price['x'].hist()
plt.xlabel('Possible Sample Median Prices of 700 Chicago Airbnbs')
plt.ylabel('Frequency')
plt.title('Simulated Sampling Distribution of Median Prices of Chicago Airbnbs')
plt.show()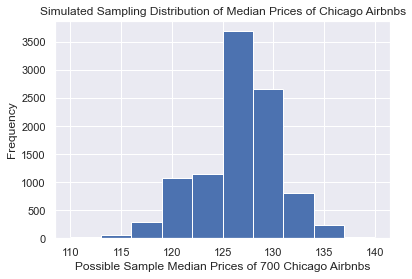
Histogram of the sampling distribution for the median price of a Chicago Airbnb.
We've now generated our sampling distribution for sample median prices of Airbnbs in Chicago. Now, suppose that I want to create a range of reasonable values for the population median prices with 90% confidence (we'll define what 90% confidence means soon). To do so, I'll find the middle 90% of this distribution by calculating the 5th percentile and the 95th percentile.
print(sampling_dist_price['x'].quantile(0.05))
print(sampling_dist_price['x'].quantile(0.95))
120.0
132.0
For our simulated sampling distribution, the middle 90% are between \$120 and \$132 per night for a Chicago Airbnb.
At last, we'll make a jump from making statements about samples to making statements about populations. We could say that a range of reasonable values for the population median price per night of a Chicago Airbnb is between \$120 and \$132 per night.
Confidence Interval Steps
To generate a confidence interval, we follow the same set of steps. We do apply some steps differently depending on our specific parameter of interest.
To generate a confidence interval, we should:
- Identify and define the parameter of interest
- Determine the confidence level
- Generate or use theory to specify the sampling distribution and check conditions
- Calculate the middle region of your sampling distribution, according to your confidence level
- Write a conclusion in the context of the problem.
Identify Parameter of Interest
We discussed identifying and defining the parameter of interest when we first described hypothesis testing. This is repeated for confidence intervals.
In this example, our population of interest is all Chicago Airbnbs. We likely would want to specify a time frame as well, and since we are using March 2023 data, we may specify that this is for all Chicago Airbnbs in March 2023.
Our parameter of interest (the summary measure) is the median. We may define the parameter of interest as $M$, the population median price per night for a Chicago Airbnb.
Determine the Confidence Level
The confidence level is analogous to the significance level. We'll provide a more exact definition and interpretation of the confidence level shortly. Confidence levels should be greater than 0% and less than 100%.
Confidence levels do not depend on the data and should be selected before observing the data. The confidence level is generally chosen based on the stakeholders and their requirements for the confidence in results. More confidence in the results are associated with higher confidence levels.
Common confidence levels include 90%, 95%, 98%, and 99%.
Determine the Sampling Distribution for the Sample Statistic
We again will use the sampling distribution of the sample statistic as the basis for our confidence interval calculation. To do so, we can follow the same process outlined for hypothesis testing. Recall, that we chose between a simulation-based resampling approach or a theory-based approach using the Central Limit Theorem to define the sampling distribution.
The biggest distinction between generating sampling distributions for confidence intervals compared to hypothesis testing is that we don't need to make any adjustments to our sampling distribution so that it is consistent with the null hypothesis. That is, recall that we wanted to adopt the skeptic's claim in hypothesis testing. When we were generating a sampling distribution, we would make any modifications necessary so that the sampling distribution fulfilled the condition of the null hypothesis. This distinction should be considered in two ways:
- when generating the sampling distribution
- when checking any necessary conditions
For example, if we were performing hypothesis testing with a simulation-based approach, we would need to first adjust the data so that the sample median was equal to the null value. However, without that condition for confidence intervals, we would use the data exactly as it is in the sample.
Similarly, some conditions for sampling distributions use information about the parameter of interest. For example, the theory-based approach with proportions requires that $n \times p$ and $n \times (1-p)$ are both at least 10. When we have a hypothesis, we should plug in the null value from the null hypothesis into these checks. With confidence intervals, if we don't have any requirements for the parameter, we can use our best estimate for $p$, which is often $\hat{p}$ when checking the conditions.
Again, the simulation-based approach requires the least number of assumptions. For our example, it is the only option for estimating the sampling distribution, since we haven't introduced theory that relates to the sampling distribution for a sample median.
Calculate the Confidence Interval
After we have determined the sampling distribution, we want to actually calculate the confidence interval, which is the range of reasonable values for our parameter of interest.
We want to find the central part of the sampling distribution that corresponds to our confidence level to generate the confidence interval, regardless of the approach for generating the sampling distribution. That is, if we want a 95% confidence interval, we will want to find the 2.5th percentile and the 97.5th percentile of the sampling distribution, so that the middle 95% is contained within those two values. In general, if we say that our confidence level is represented as CL%, then we want the (100-CL)/2 and (100+CL)/2 percentiles. We can find these percentiles both for a simulated sampling distribution or for a well-defined distribution, as long as we provide Python with the appropriate information.
This might seem counterintuitive, as we are using information about our sample to generate a guess about our population. To understand this, let's start by saying that this range would be a range of typical values for a sample statistic as calculated from our available data. Then, we're going to switch the order of the statement. This indicates that a sample statistic like the one we found would be reasonable if our parameter were anywhere in that range instead. Therefore, we'll say that the confidence interval that we calculated represents a range of reasonable values for the parameter.
Write a Conclusion in the Context of the Problem
Finally, we've generated our confidence interval and want to communicate our results to other stakeholders. What exactly does the confidence interval mean?
Informally, we might say something like: it is reasonable to claim that the population median price for a Chicago Airbnb is between \$120 and \$136 per night, with 90% confidence.
The formal interpretation is that we are 90% confident that the true population median price for a Chicago Airbnb falls in the range of \$120 and \$136 per night.
Confidence Interval Widths
Say that a stakeholder is not satisfied with a confidence interval. A common concern is that a confidence interval is too wide; that is, your stakeholder would like a narrower range of reasonable values. What can be changed to satisfy your stakeholder?
The two adjustable factors that affect the width of the confidence interval are the:
- sample size
- confidence level
Larger sample sizes result in narrower sampling distributions (recall this feature of the standard error from our sampling distribution module). This will also result in our confidence interval being narrower.
Larger confidence levels require a larger component of the sampling distribution to be included in the confidence interval. This will result in a wider confidence interval.
Therefore, if your stakeholder wants a narrower confidence interval, you could add more observations to your sample size or you could reduce your confidence level. It is also possible to estimate a desired sample size before gathering data that results in a confidence interval with limitations on the width of the confidence interval. We will skip over this calculation for our course, although you may encounter it in a future course.
Confidence Interval Misconceptions and Misinterpretations
We've discussed briefly what a confidence interval means. Equally important is what a confidence interval does not imply.
A confidence interval does not correspond to:
- the probability that the parameter is in the confidence interval
- a range of reasonable values for the sample data
- a range of reasonable values for a sample statistic
- a range of reasonable values for any future results from another sample
These last three misconceptions stem from misunderstanding that the confidence interval is about the parameter of interest and not about the sample or any of its corresponding characteristics.
For the first statement, consider that the population is already defined, and the corresponding parameter value for the population could then be calculated. It is a specific number, and it doesn't change. For example, it might be 120 or it could be 145. However, since the population is fixed, it is that exact number.
Once the confidence interval is calculated, then the confidence interval is also set and determined. It won't change. In this case, the parameter will either be contained in our confidence interval or it won't be, so the probability associated with the parameter being in the confidence interval is either 0 (the confidence interval isn't correct) or 1 (the confidence interval is correct).
Confidence Level Interpretation
We now understand how to calculate a confidence interval, what the confidence interval indicates, and what it doesn't indicate. However, we need to return to the second step where we set the confidence level for the interval. We know that this will have ramifications for the following steps of generating a confidence interval. But, what does it mean?
The confidence level means:
"If we gathered repeated random samples of the same size and calculated a CL% confidence interval for each, we would expect CL% of the resulting confidence intervals to contain the true parameter of interest."
Generally, this means that we expect CL% of our intervals to be correct. However, as we discussed above, we can't apply this reasoning to one specific interval after it's been calculated. This still does allow for variability and for different confidence intervals being generated from different samples.
Hypothesis Testing Decisions through Confidence Intervals
You may have noticed that many of the steps used for confidence intervals are shared with hypothesis testing. While there are distinctions between the two, we can also use confidence intervals to help us determine the result of a hypothesis test.
Suppose that a friend found it reported that the median price for all Chicago hotels is $160 per night. They suspect that Airbnbs are less expensive per night, and the population median price for Chicago Airbnbs is less expensive.
That is, the parameter of interest would be $M$ the population median price per night for all Chicago Airbnbs in March 2023. We can (and have) found the corresponding sample statistic, $m$ or the median price per night for the Chicago Airbnbs from our sample.
Because we don't have any data to analyze for Chicago hotels, we'll use this number as if it were true and treat this as a test for only one population. Our hypotheses would be:
$H_0: M = 160$
$H_a: M < 160$
What does the data say? If we've already generated a confidence interval, we don't need to repeat many of the steps for hypothesis testing. Instead, we can consider our calculated confidence interval as a range of reasonable values for our parameter. That is, it is reasonable that the population median price per night for all Chicago Airbnbs is between \$120 and \$136. In this case, the null value of 160 is not included in the range of reasonable values. Everything reasonable falls under the alternative hypothesis. We would want to reject the null hypothesis and adopt the alternative hypothesis as a more reasonable claim.
In this case, our confidence interval clearly supports our alternative hypothesis rather than our null hypothesis. However, in order to use confidence intervals to anticipate the decision for a hypothesis test, we need to ensure that we are using comparable confidence and significance levels:
- for a two-sided alternative hypothesis, use a confidence level of $1-\alpha$
- for a one-sided alternative hypothesis, use a confidence level of $1-2\times\alpha$